Understand your reports
A guided tour of the Reports & Analytics tab: what every panel shows, which number to act on, and how to read your programme in two minutes.
By Nora Ellis, Affiliate Marketing & Creator Economy Writer · with Wooly Network, Advertiser Success · 31 August 2026 · 5 min · Marketplace Best Practices
Everything your campaigns produce lands in one place: the Reports & Analytics tab in your advertiser dashboard. This guide walks down that page panel by panel, with a screenshot of each one, so you know what you are looking at and which number to act on.
The screenshots come from a demo account with real activity in it, so you can see what a busy month looks like. Your own page will show your numbers for the dates you pick.
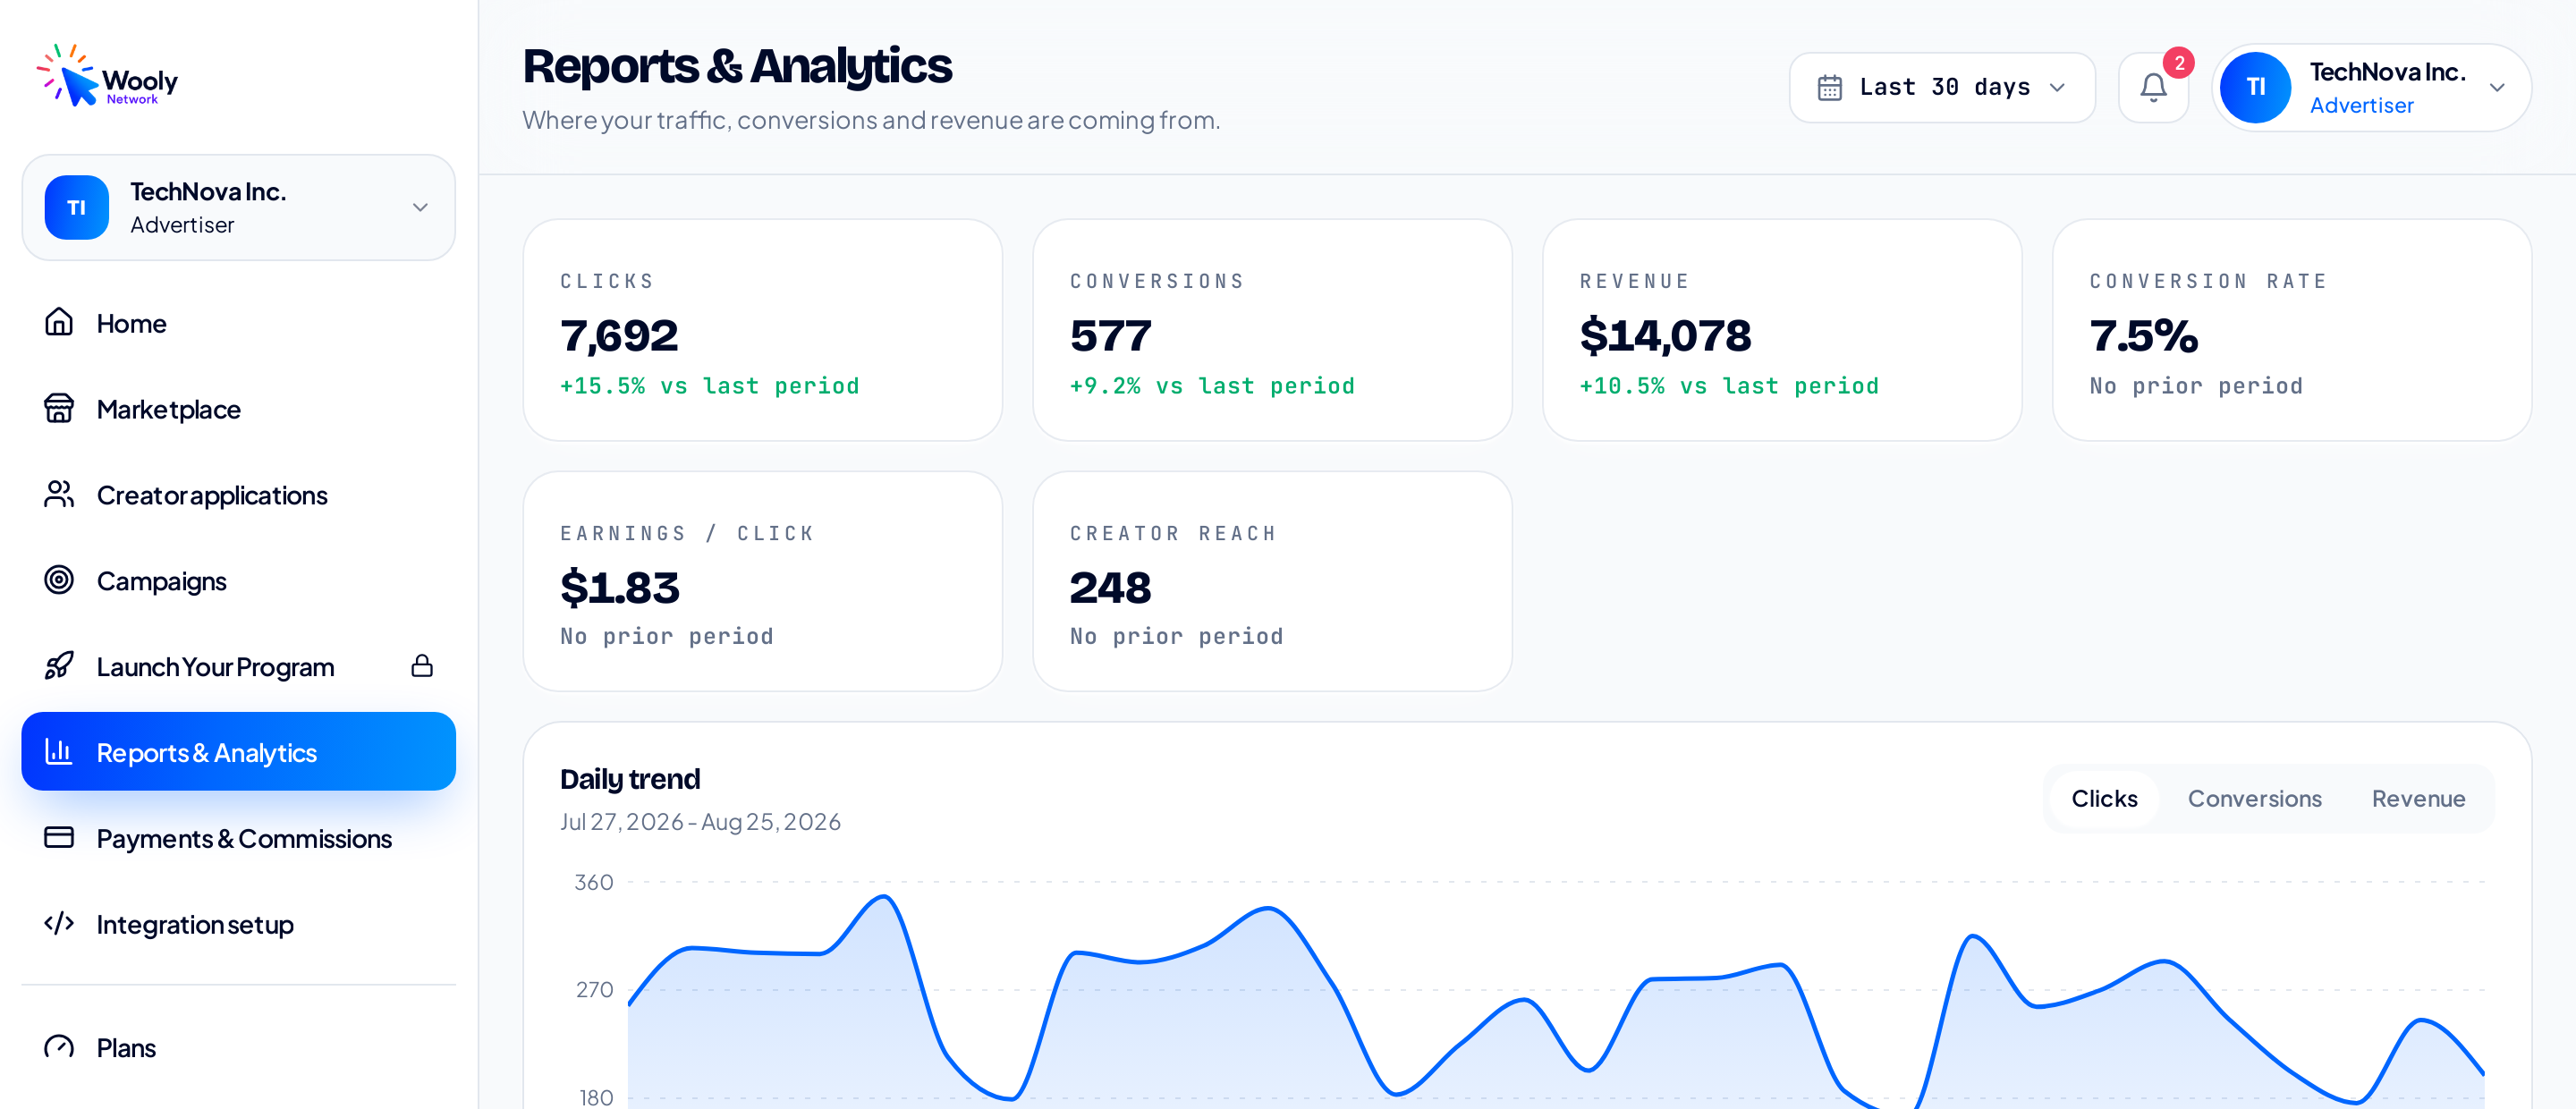
The whole tab: totals at the top, then the trend, your costs, your commission review, weekday patterns, and finally the per-campaign and per-creator breakdowns.
First: pick your dates
Every single number on this page obeys the date picker in the top right corner. Change the dates and the whole page recalculates.
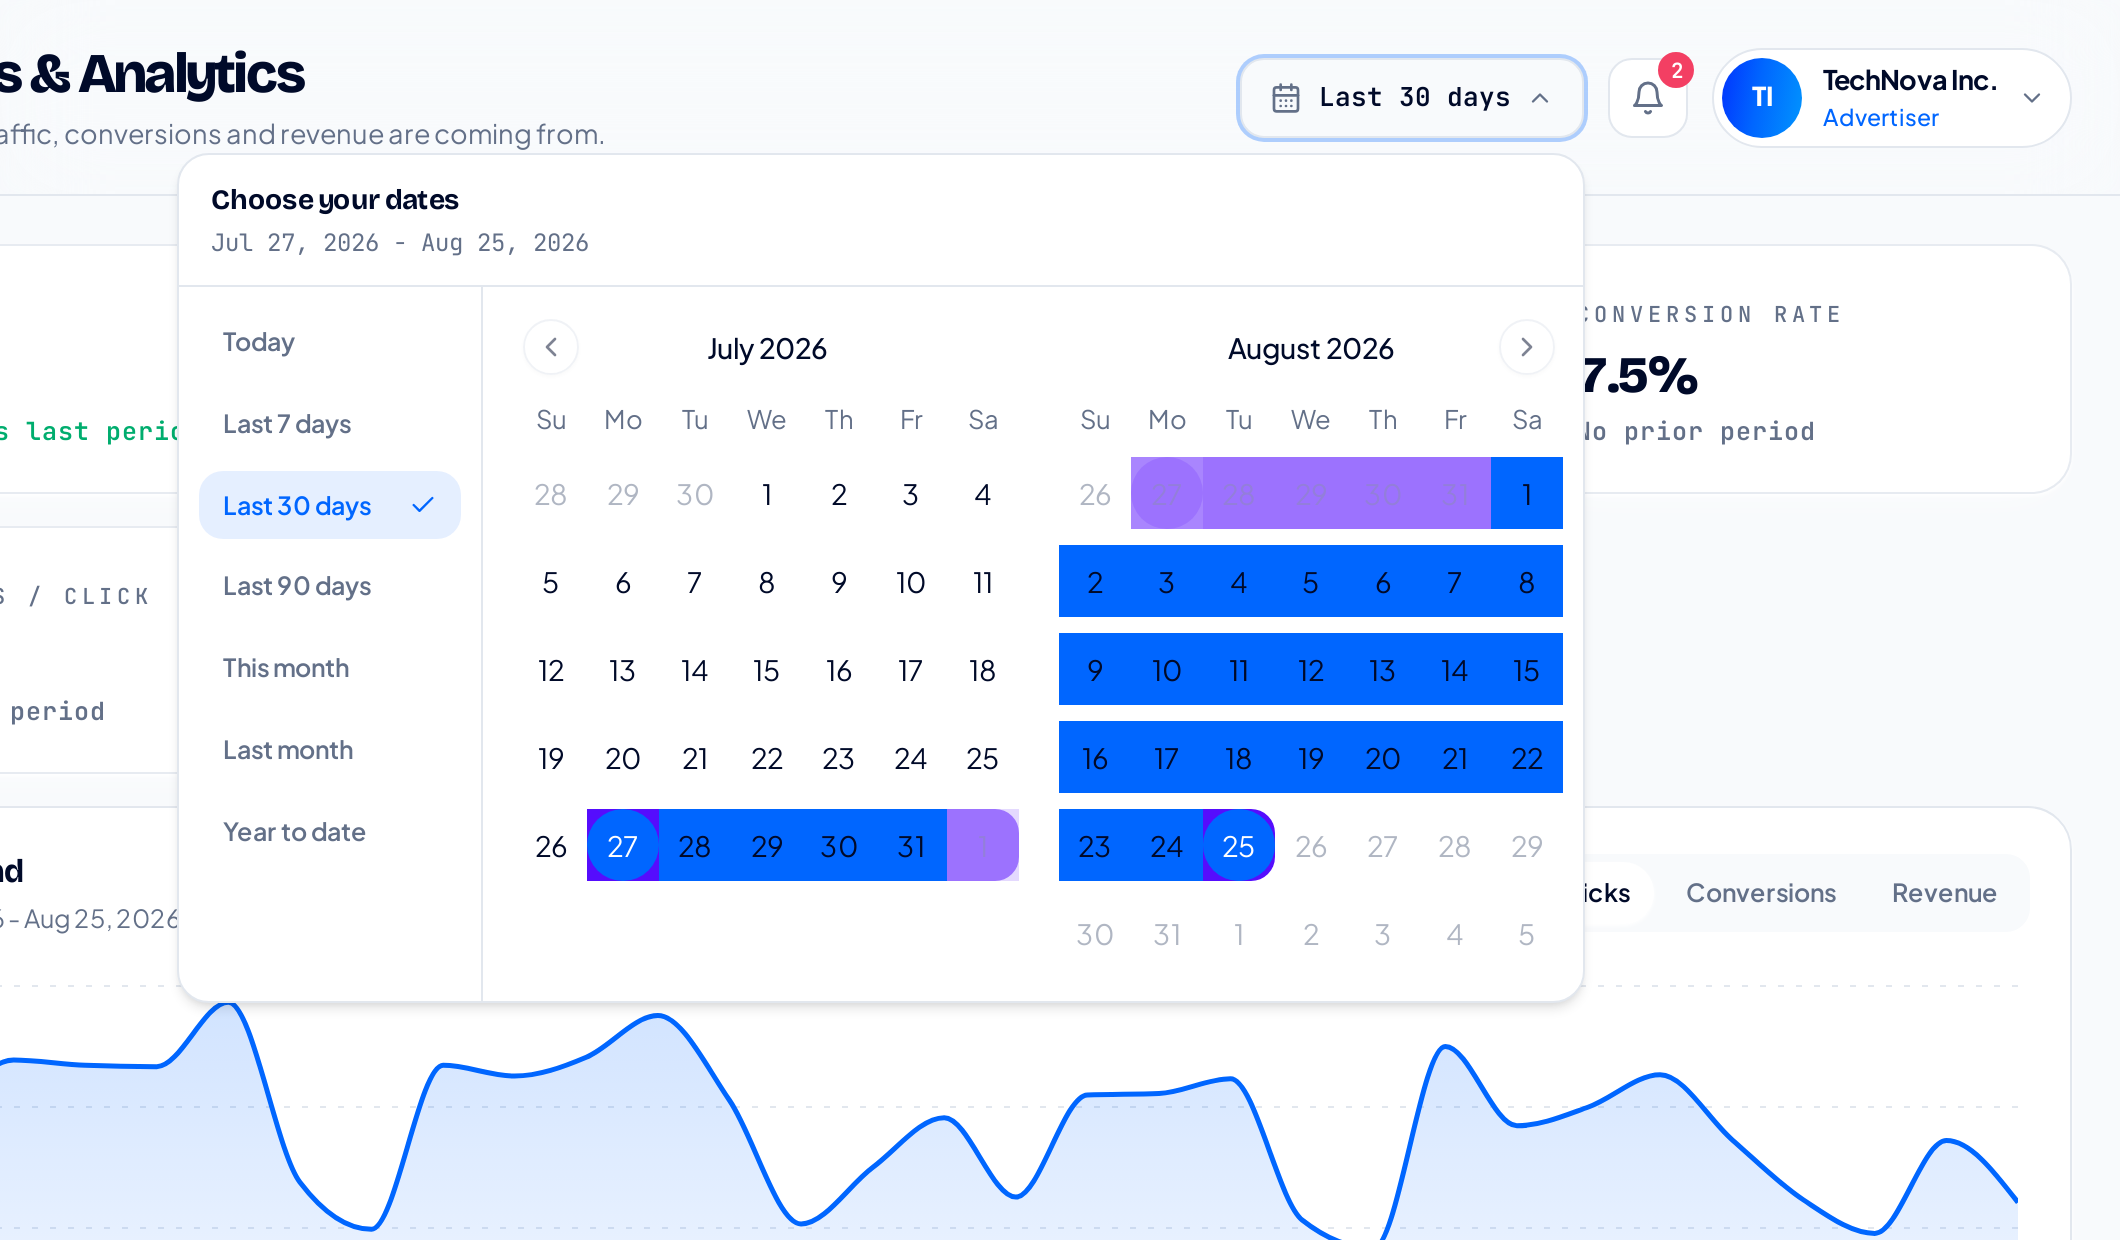
Presets for Today, Last 7 / 30 / 90 days, This month, Last month and Year to date, or click two days on the calendar for a custom window. Last 30 days is the default.
One thing worth knowing: the small green or red percentages you see next to the totals always compare your window to the window right before it, of the same length. Pick Last 30 days and you are being compared to the 30 days before that. That is why the comparison stays fair when you switch presets.
The totals at the top
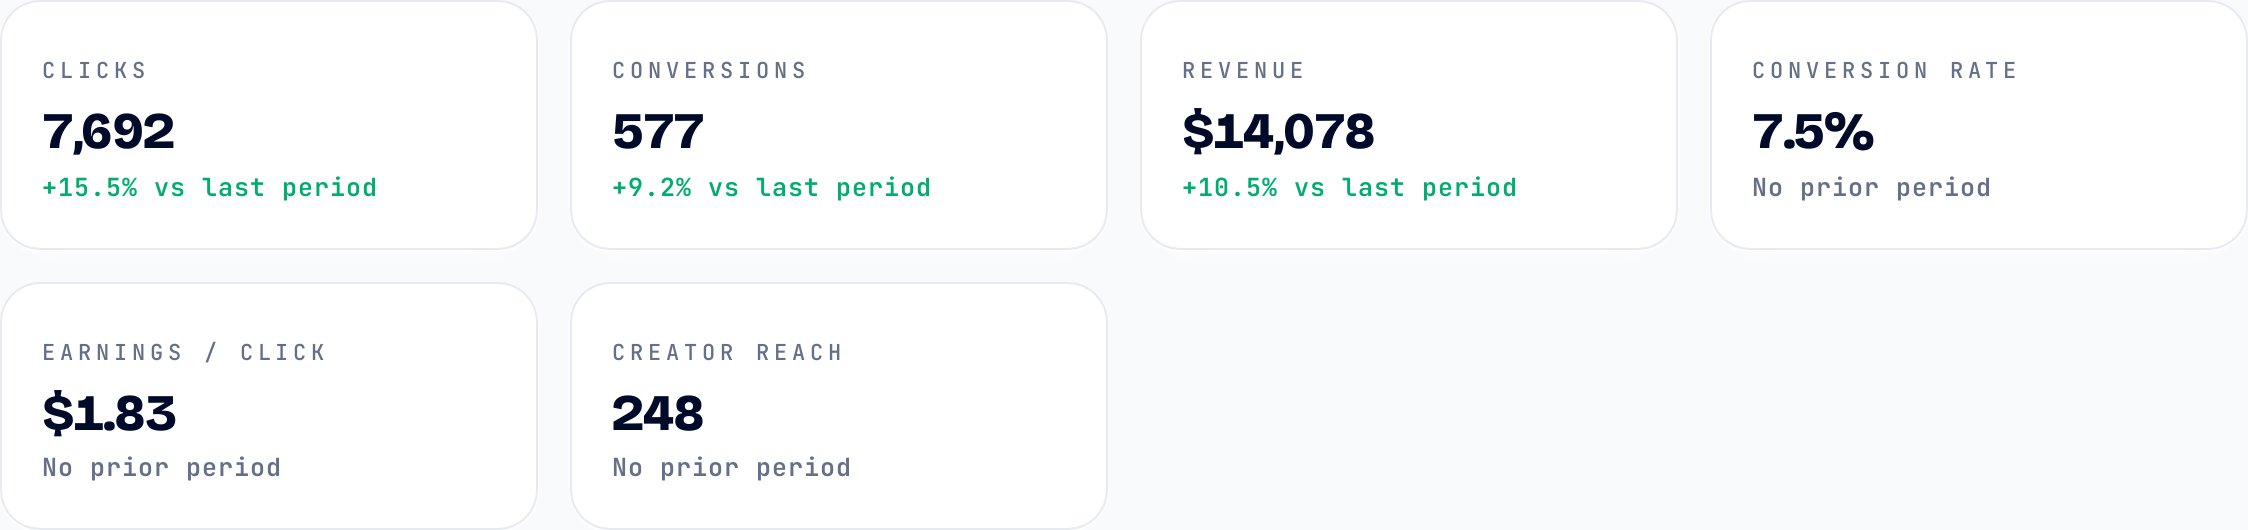
The six headline numbers for the dates you picked, each with its change against the previous period.
A quick read of each card:
- Clicks; visits sent to you through creator tracking links.
- Conversions; the sales or leads those visits turned into.
- Revenue; the order value your creators generated.
- Conversion Rate; conversions divided by clicks.
- Earnings / Click; revenue divided by clicks, so you can compare campaigns of different sizes.
- Creator Reach; how many creators were active for you in these dates.
A note on clicks, conversions and conversion rate: tracking-link reporting is still being connected, so treat those three as directional for now rather than final. Revenue, your costs and your commission review are the numbers to plan around today. We will update this article the moment click tracking is live.
Daily trend
The same story over time instead of as one total. The three buttons above the chart switch what is plotted.
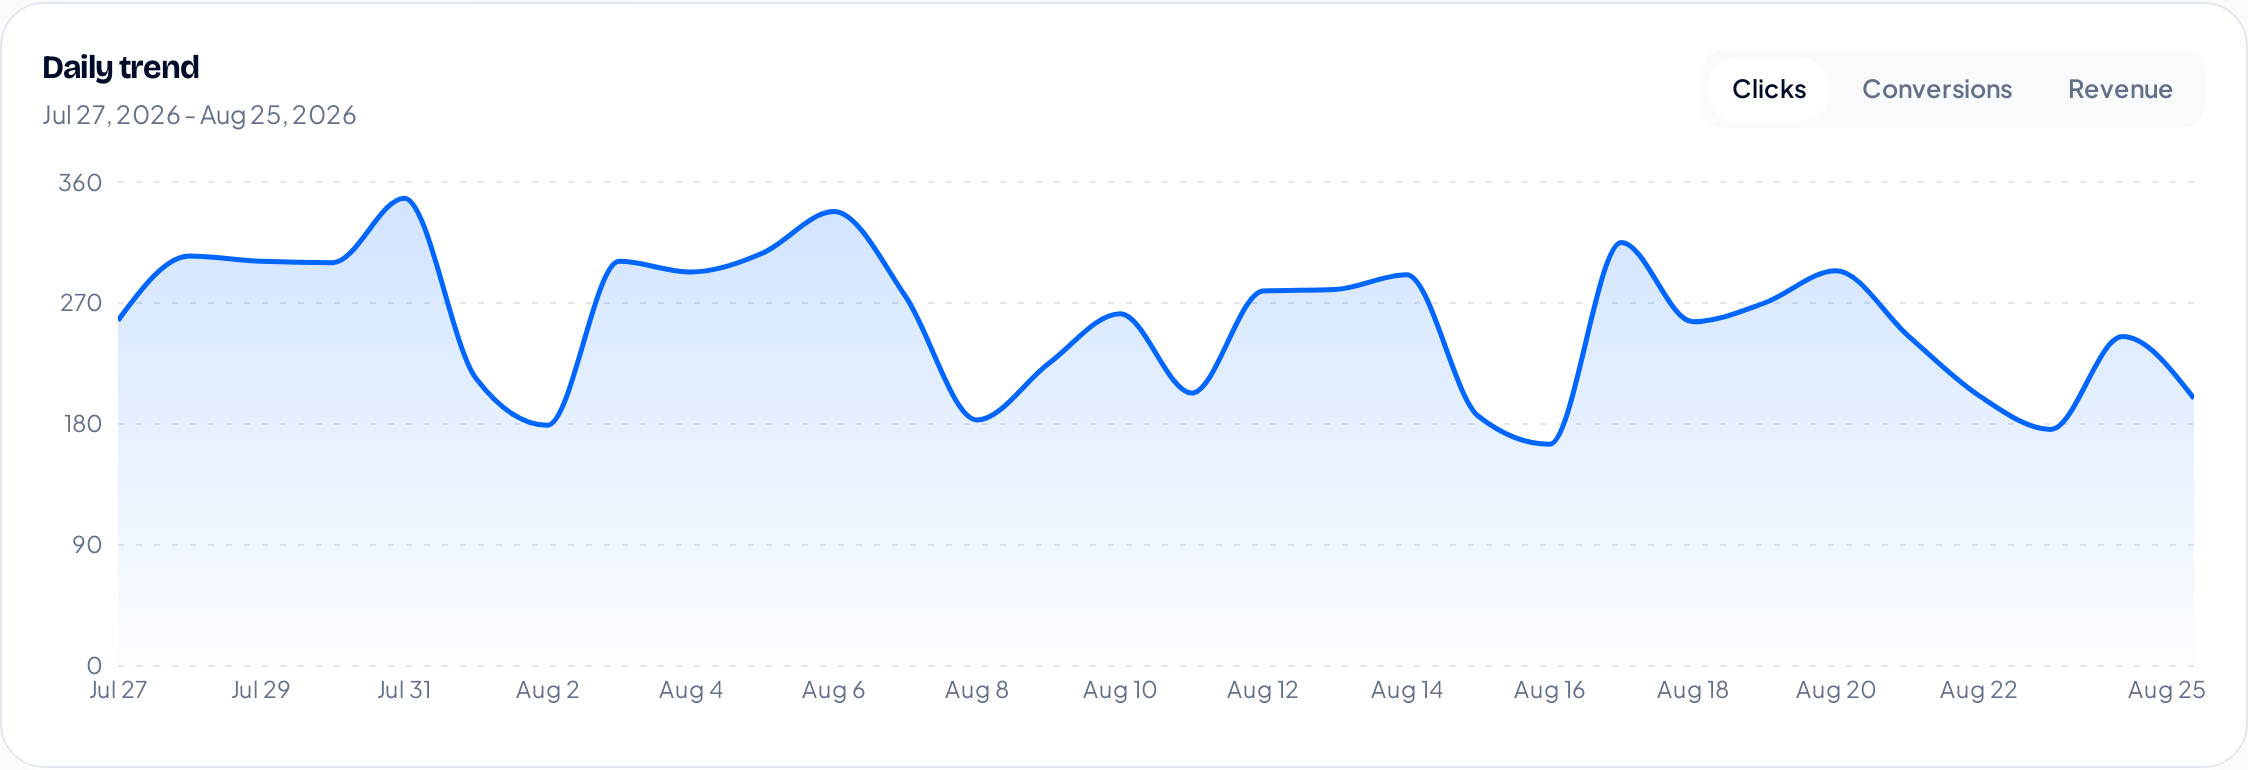
Clicks day by day. Hover any point to see that day's exact figure.
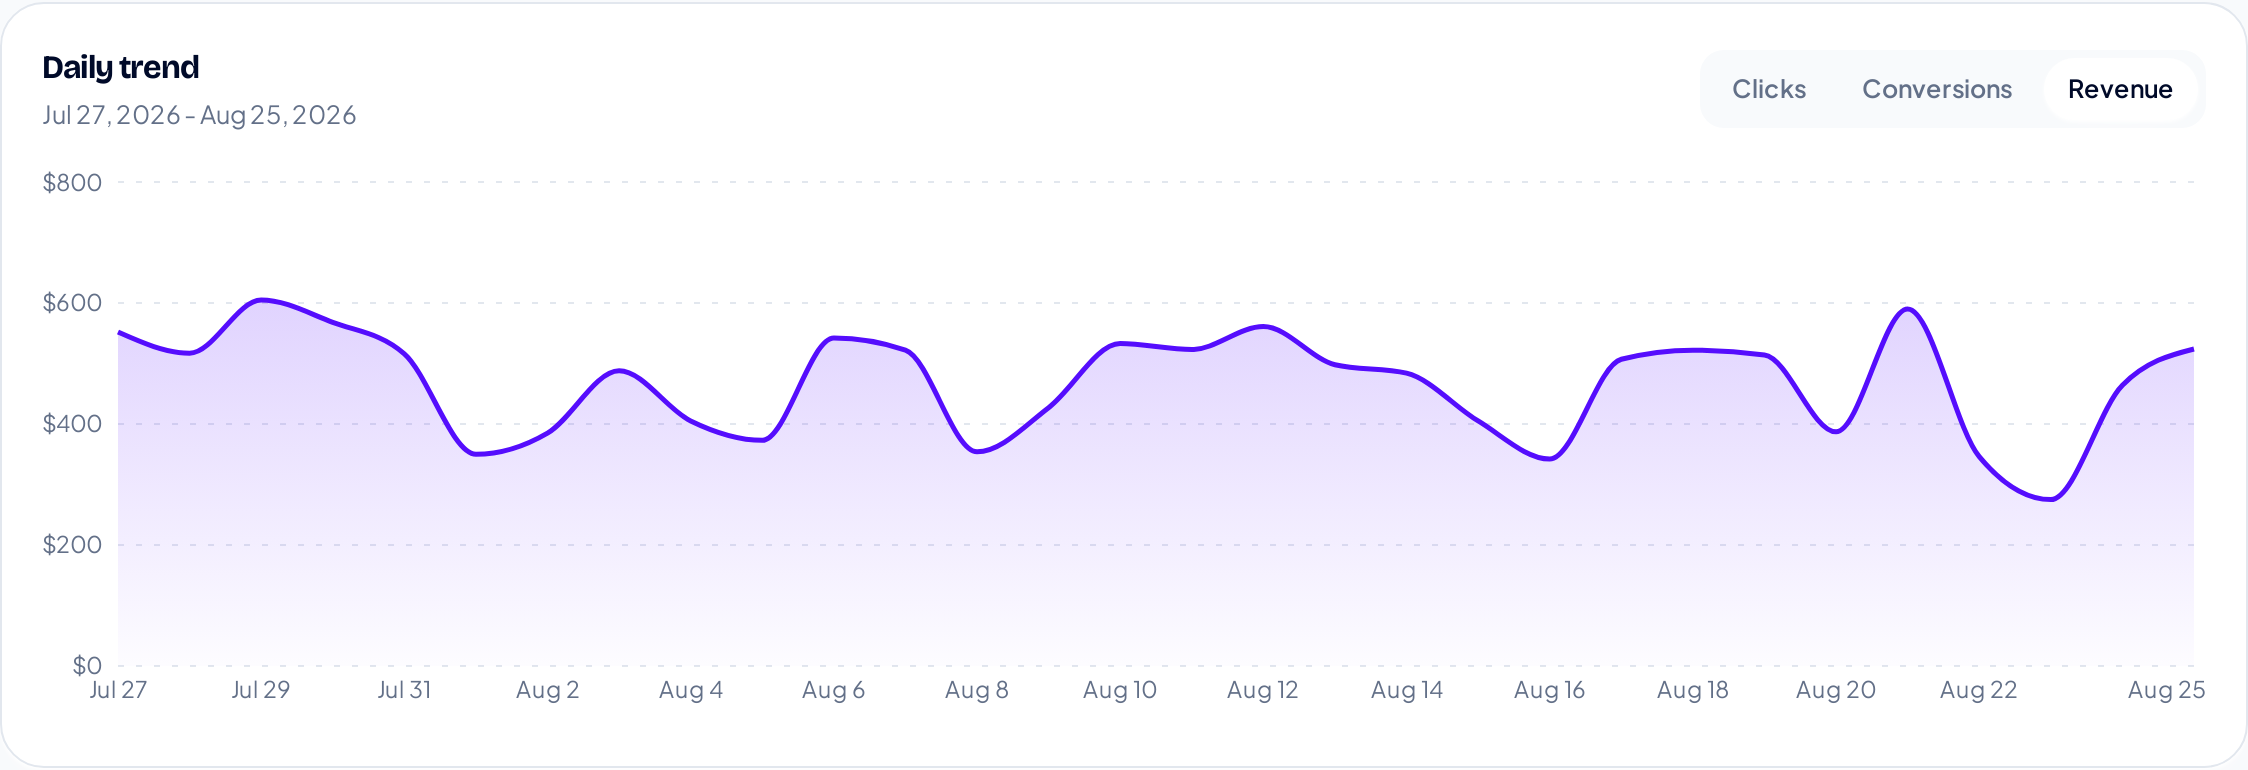
The same window switched to Revenue. Use this to spot the days a creator posted, a promo ran, or something broke.
What to look for: a flat line that suddenly steps up usually means a new creator went live; a sharp drop on a single day is usually a broken link or an out-of-stock product worth checking.
Cost & return
This is the panel most advertisers open first, because it answers "did this make money?".
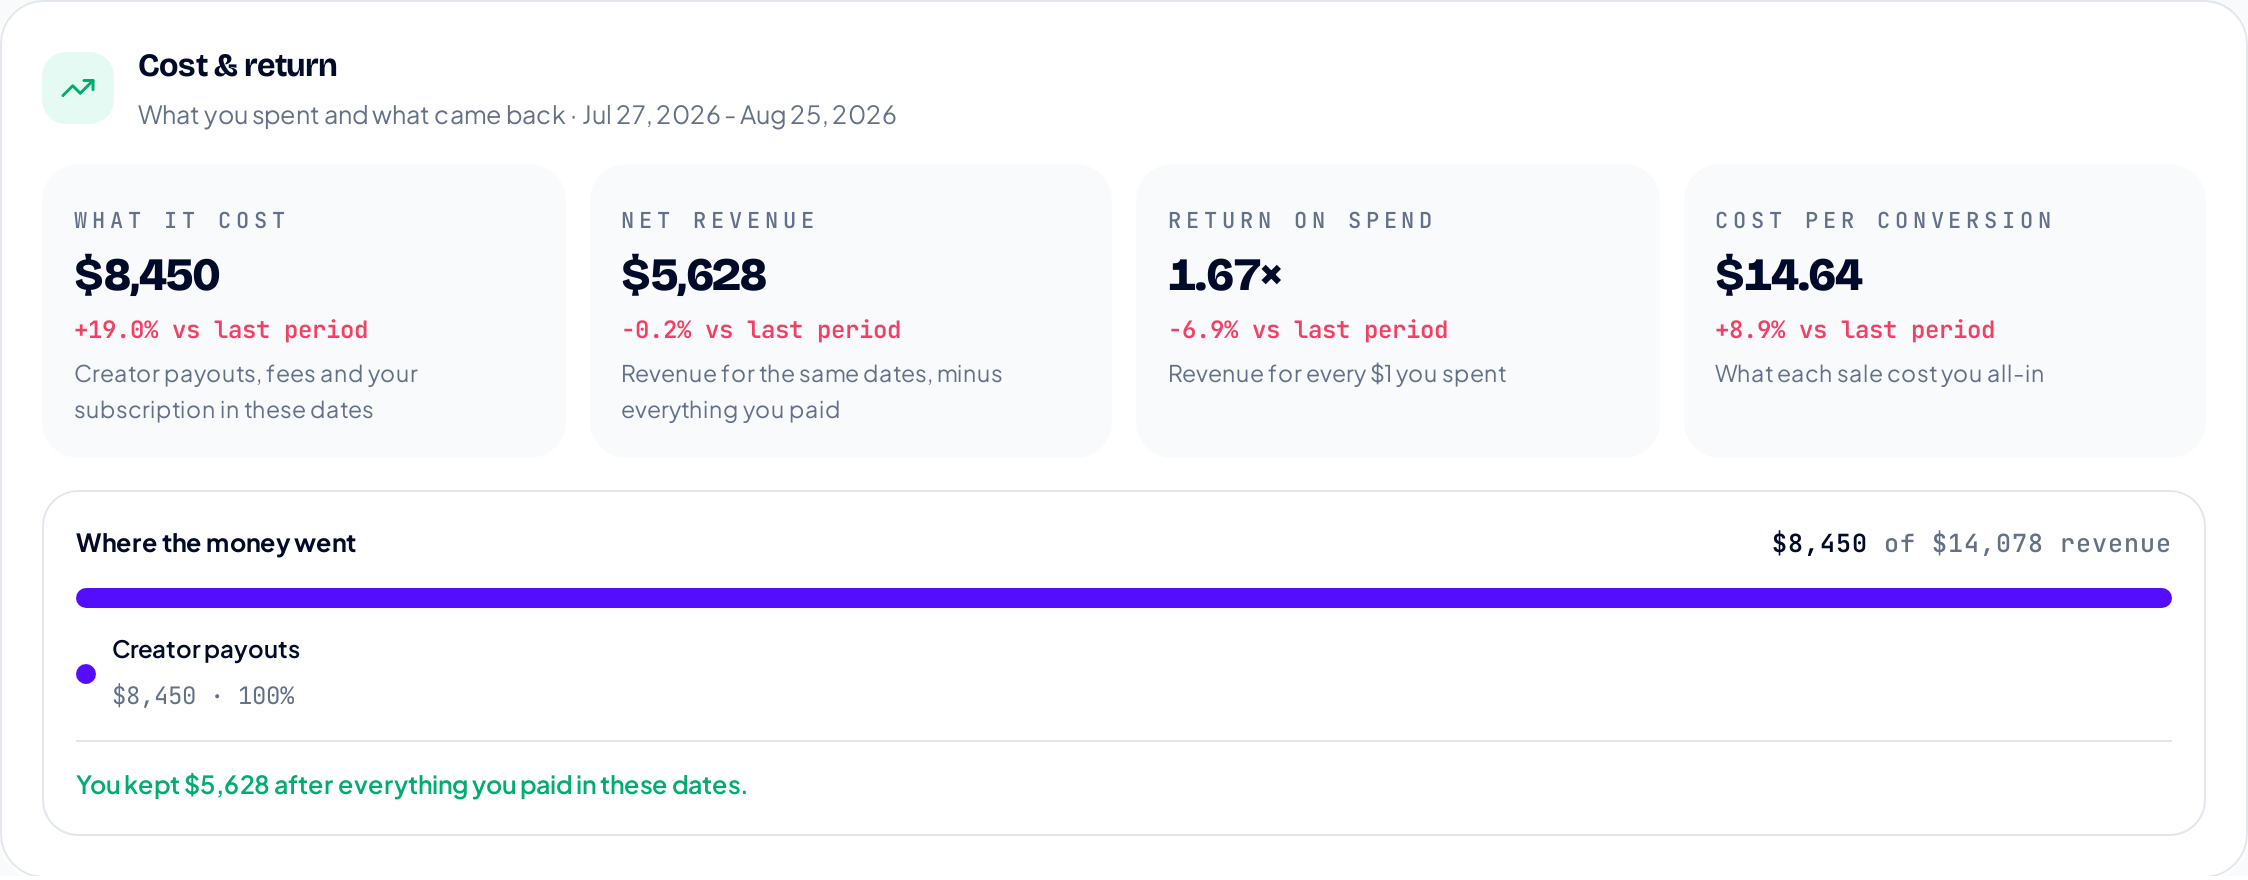
What it cost, your net revenue, your return on spend, and your cost per conversion, plus where the spend actually went.
- What it cost; creator payouts, platform and add-on fees, and your subscription, added together for these dates.
- Net revenue; revenue minus that cost.
- Return on spend; how much revenue every $1 you spent brought back. Anything above 1× is profitable on this measure.
- Cost per conversion; your average cost to win one sale or lead.
The breakdown bar underneath splits the spend into creator payouts, platform and add-on fees, and subscription; handy when your cost jumps and you want to know which part moved.
Commission review
Creators are paid on commissions you approve, so how fast you review matters to them and to your cash flow.
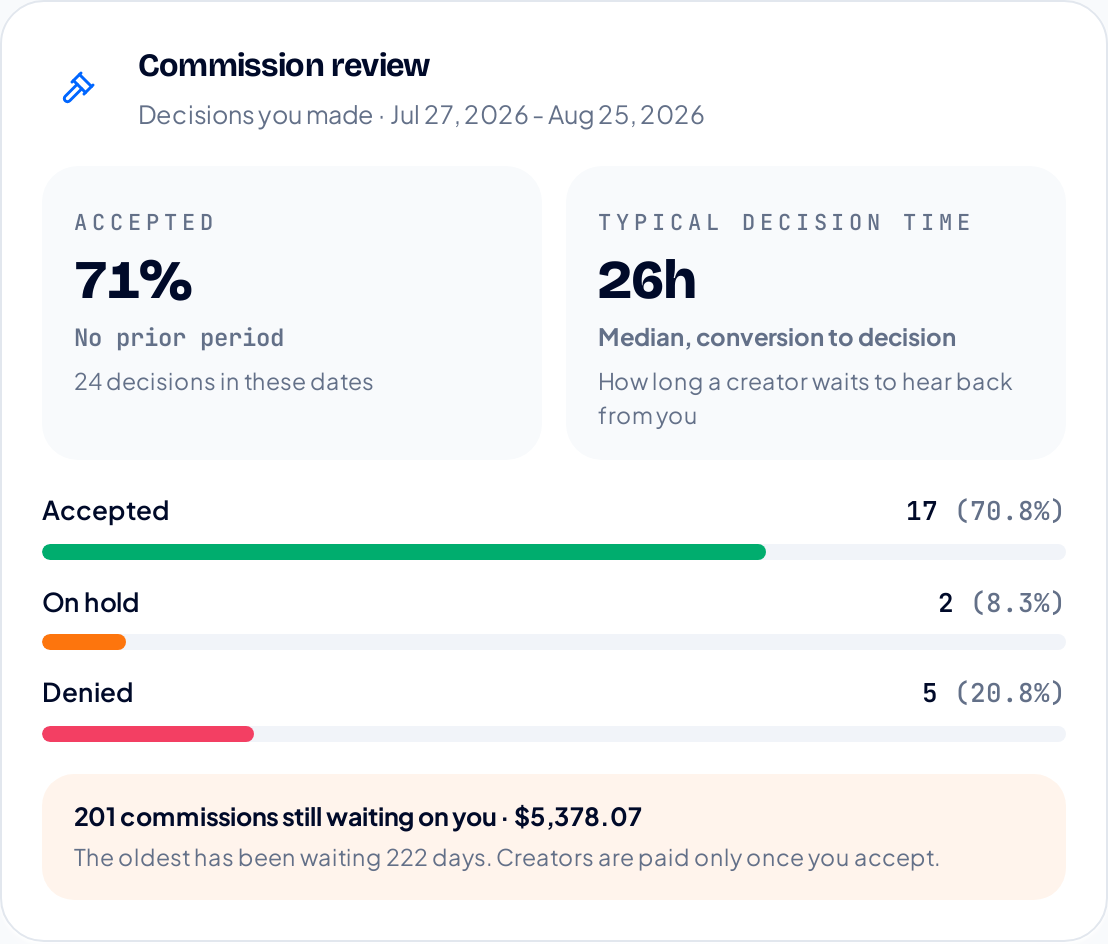
Your acceptance rate, how long you typically take to decide, the accepted / on-hold / denied split, and what is still waiting on you.
The number to watch is waiting on you and the amount attached to it. Creators can see that they are waiting, and a long queue is the fastest way to lose your best partners. The "oldest pending" line tells you how far behind you are.
Best days of the week
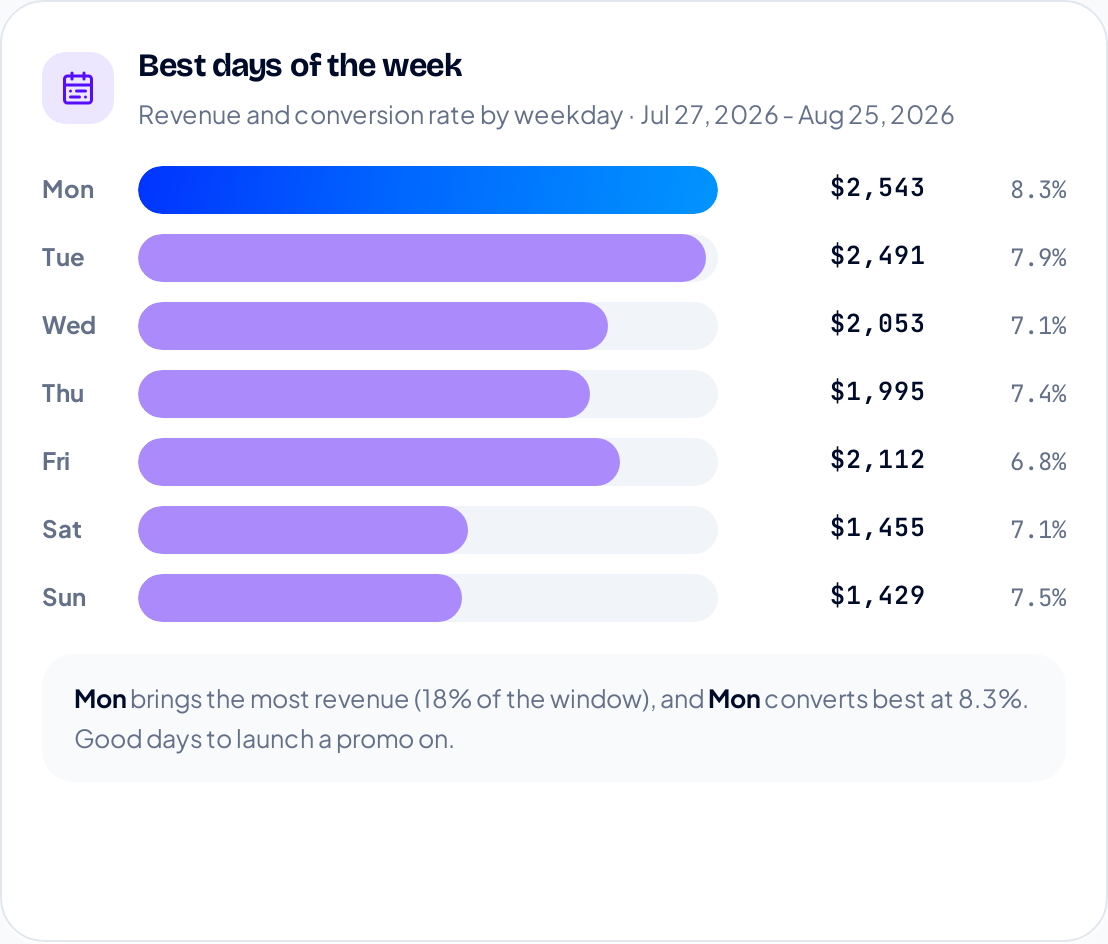
Revenue per weekday inside your chosen dates, with each day's conversion rate on the right.
Each bar adds up every occurrence of that weekday in your window, so the split changes as you change the dates. Use it to time promos, briefs and creator posting days around the days that actually sell.
Rejected Commission Value
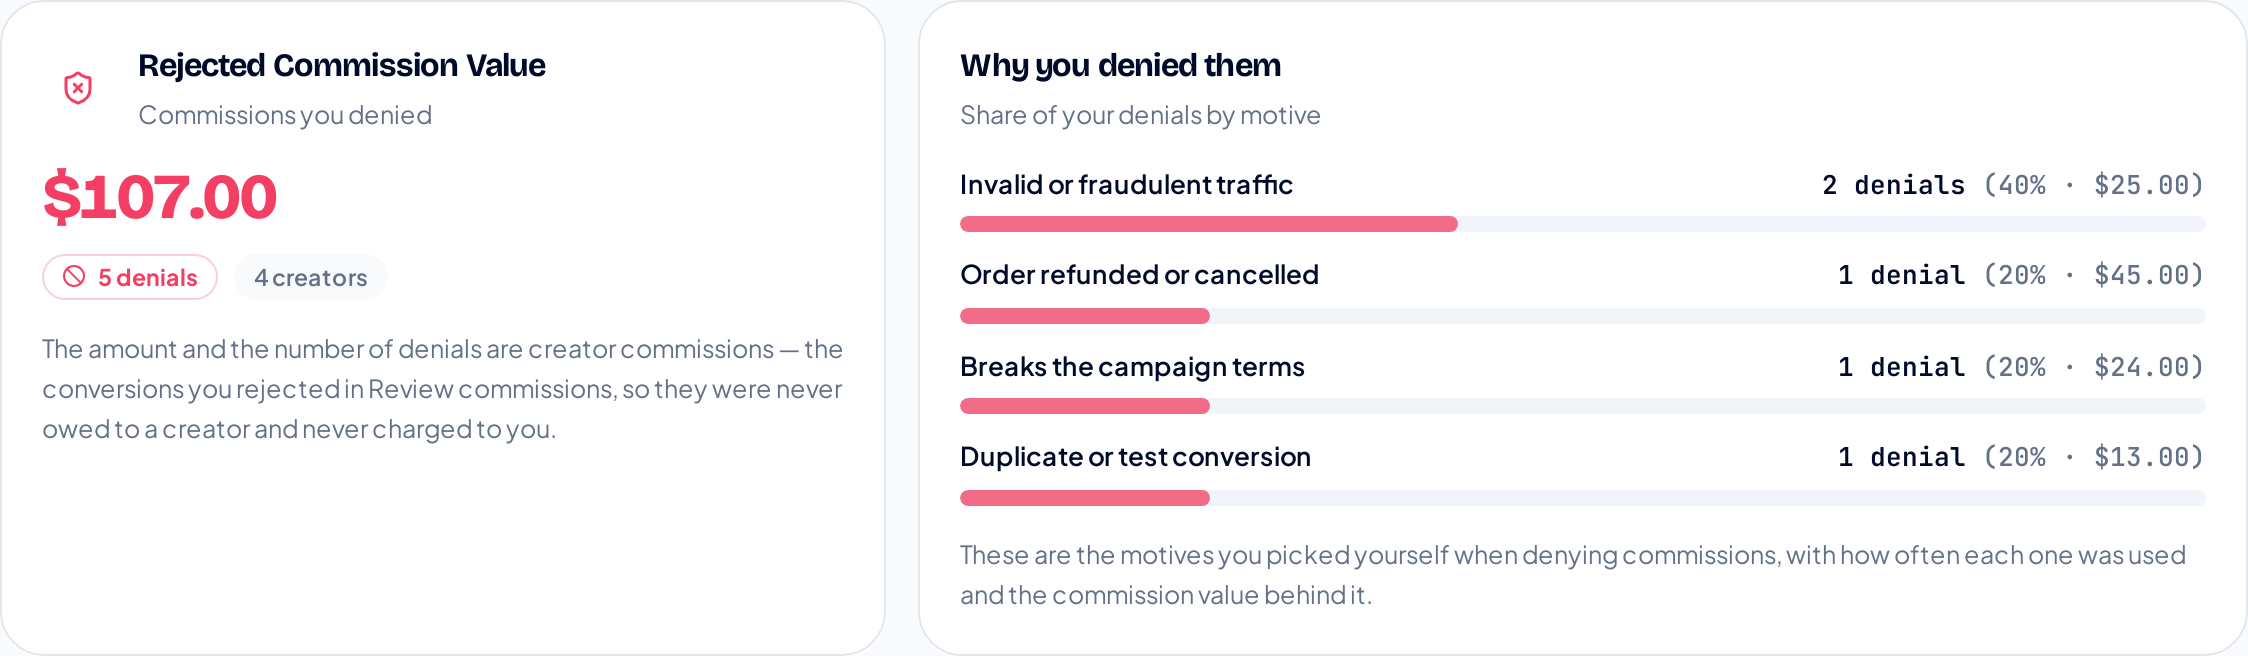
How much value you denied, over how many commissions and creators, and the reasons behind the decisions.
The reasons come straight from the choices you make when you deny a commission. If one reason keeps repeating (invalid traffic, refunded orders, breaking the campaign terms) that is normally a campaign rule to tighten or a creator to talk to, not just a number to note.
By campaign
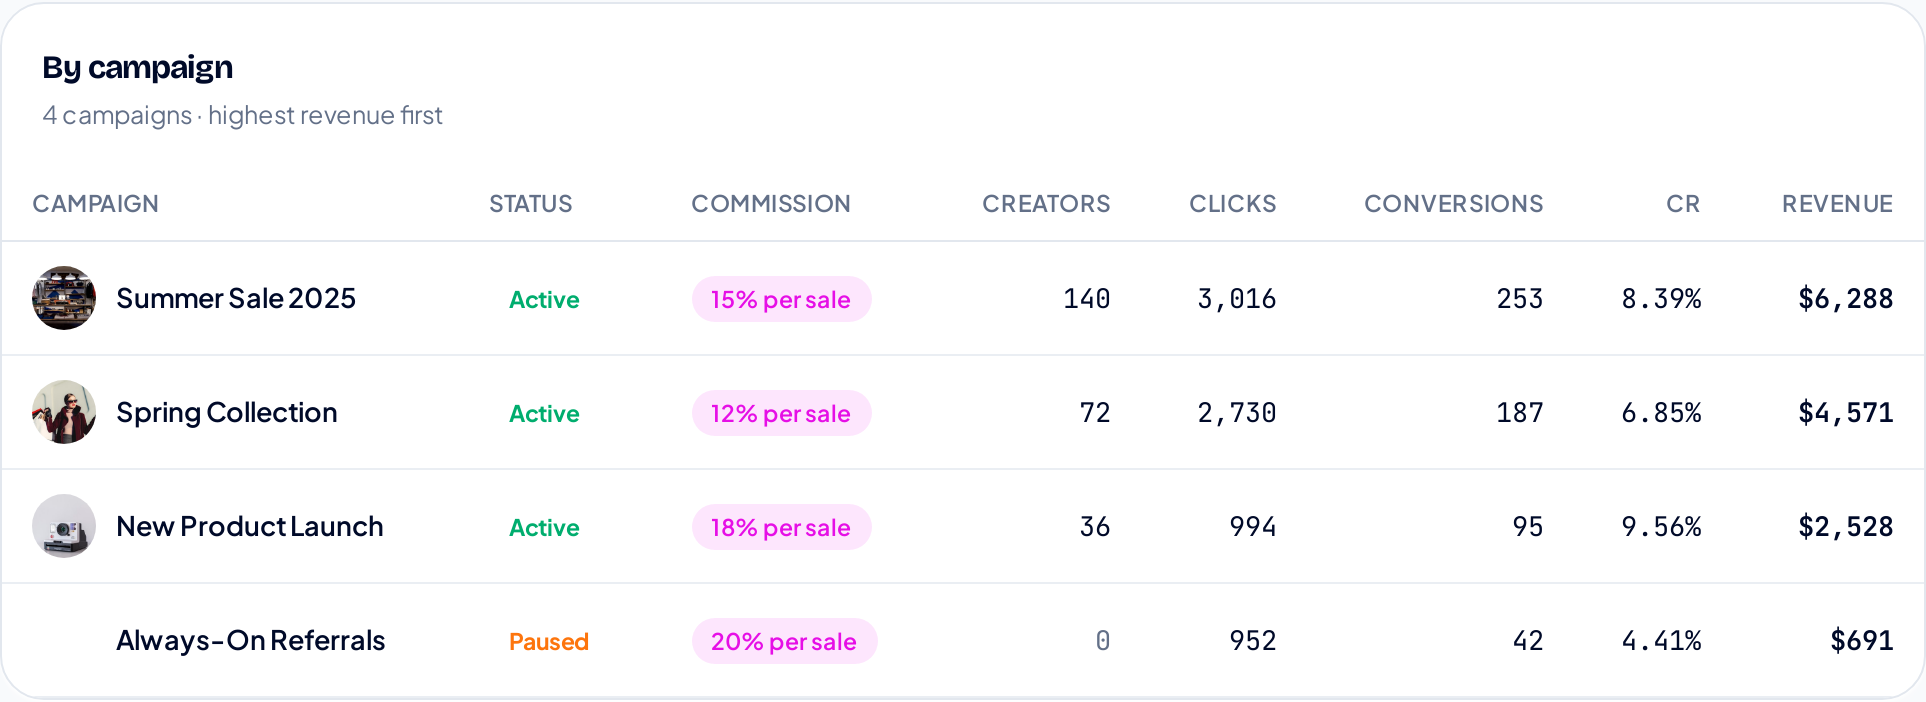
Every campaign side by side: status, commission, creators, clicks, conversions, conversion rate and revenue.
This is where you decide what to do next. Sort your eye down the revenue column: the campaigns carrying the programme deserve more creators and a better commission, and the paused or flat ones are candidates to rewrite or retire.
Creator activation
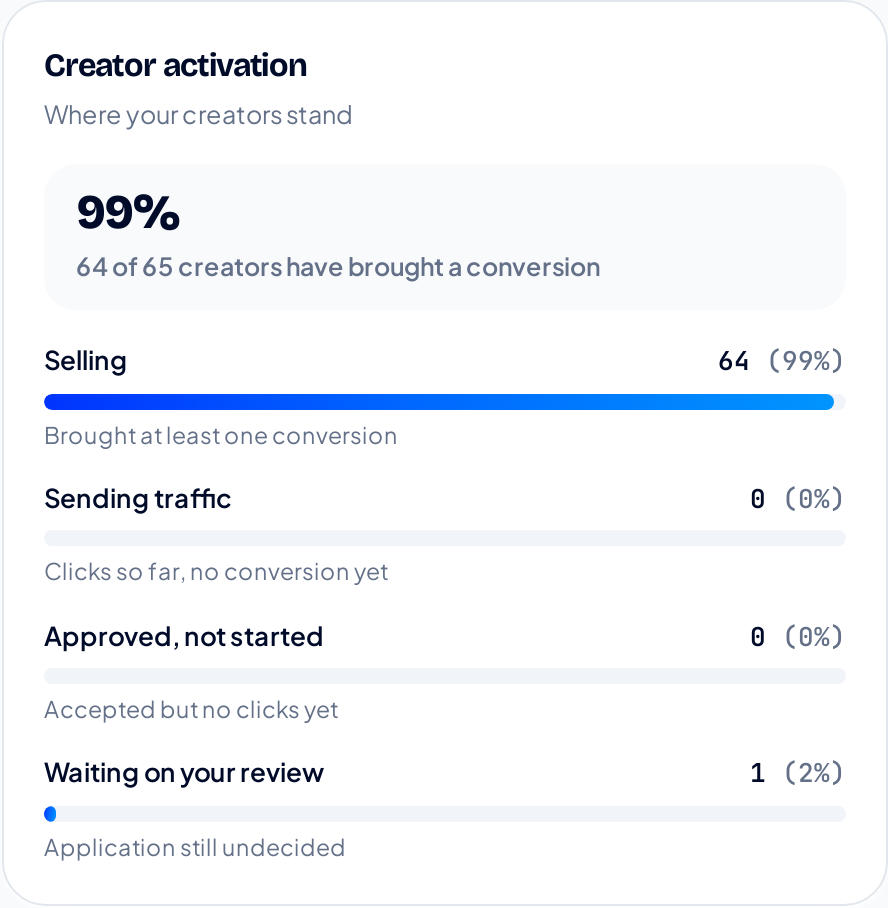
Where your approved creators actually are: selling, sending traffic, approved but not started, or still waiting on your review.
Approving a creator is not the same as activating them. This panel shows how many made it all the way to selling. A large "approved, not started" group usually means your promo materials or brief need to be clearer, and anyone stuck in "waiting on your review" is a creator you have not answered yet.
How to read the page in two minutes
- Set the dates you care about.
- Check Net revenue and Return on spend: is the programme paying for itself?
- Check what's waiting on you in Commission review and clear the queue.
- Scan By campaign for the winners and the dead weight.
- Scan Creator activation for creators who need a nudge.
Next steps
Not launched yet, or want a second campaign? Read How to create your first Campaign: a step-by-step walkthrough of the Launch Your Program tab, with screenshots of every field and all four campaign types.
Need to run more campaigns at once? The number of campaigns you can have live at the same time comes from your plan. Open your plan and billing page to see what your current plan includes and upgrade when you are ready for more.
Related reading
- How to approve the right creators — A walkthrough of the Creator applications tab: every status explained, what each button does, and exactly what changes for the creator when you press it.
- How to create your first Campaign — A step-by-step walkthrough of the Launch Your Program tab: every field, all four campaign types, and exactly what creators see when you publish.
- How to set commission payment terms — The waiting period creators see before they apply: what 30 and 60 days mean, and how to pick yours in four clicks.
More from the Wooly Network Knowledge Library