How the Reports & Analytics tab works
A step-by-step walkthrough of your Reports & Analytics tab: the dates, the cards, the trend, the offer table, and the two category panels, and how to read each one.
By Nora Ellis, Affiliate Marketing & Creator Economy Writer · with Wooly Network, Creator Success · 31 August 2026 · 7 min · Performance Marketing
Reports & Analytics is the tab that tells you which of your campaigns is actually working. It does not ask you to build a report or pick fields; the page is already assembled, and everything on it answers to one thing: the dates you choose at the top. Here is the whole tab, step by step, in the order you read it.
Where you find it
In your creator workspace, open Reports & Analytics in the left sidebar. It sits between My Campaigns and Earnings & Payouts, which is roughly the order things happen: you join a campaign, you see how it performed, then you get paid for it.
The header says what the page is for - how your content is performing, offer by offer. Every panel below is your own campaigns counted a different way.
Step 1: Pick your dates first
Start here, always. The date picker in the top right decides every number on the page, so changing it changes the whole tab at once. It opens on Last 30 days when you arrive.
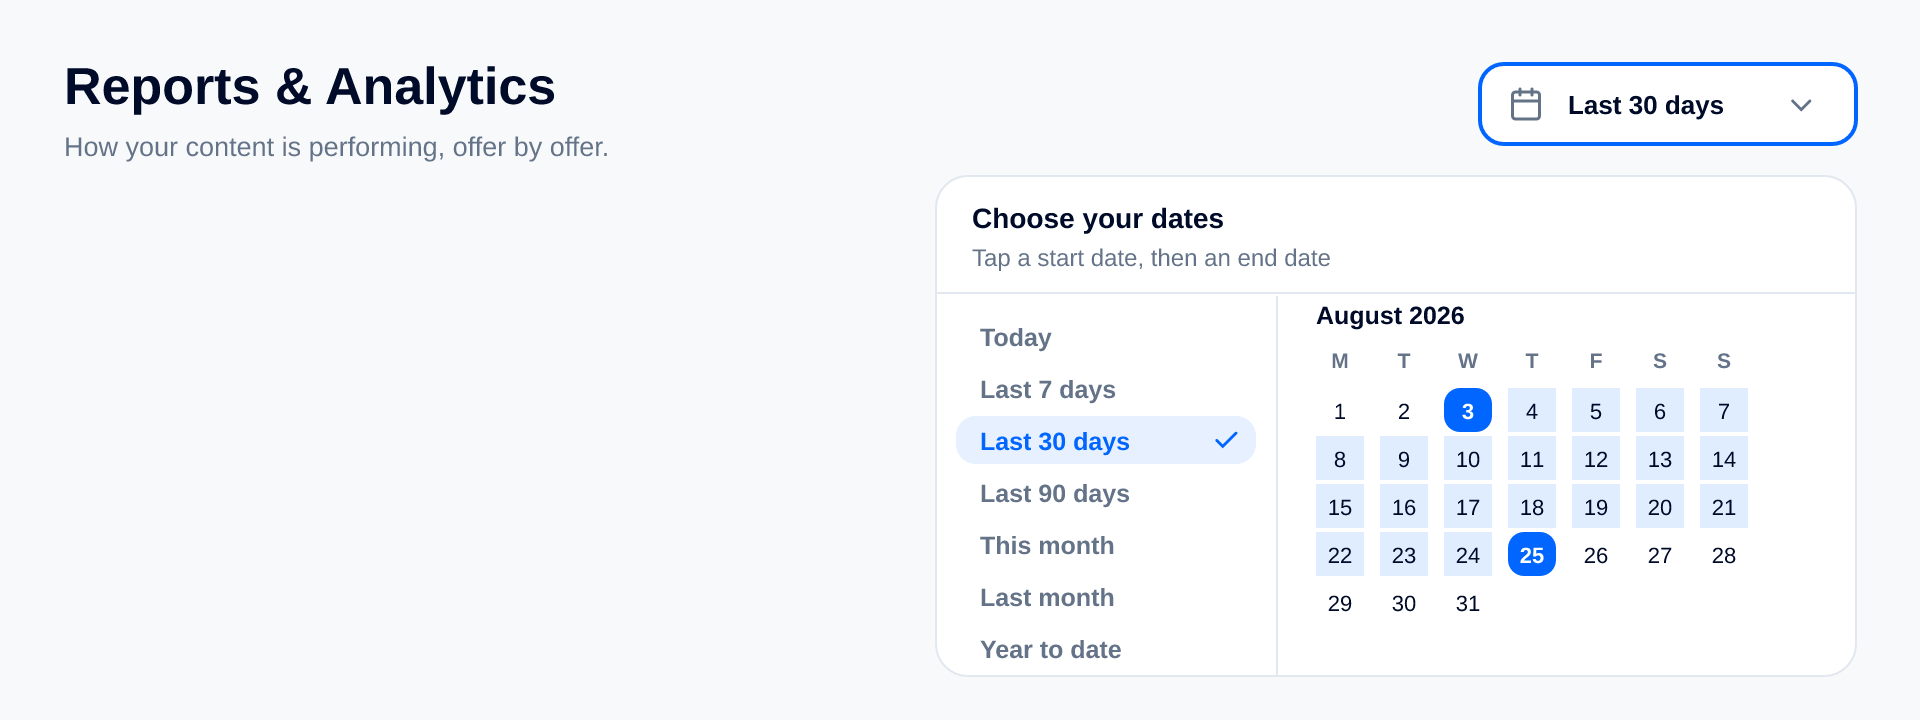
Tap it, and you get the shortcuts down the left; Today, Last 7 days, Last 30 days, Last 90 days, This month, Last month, Year to date - and a calendar for anything else. For a custom window, it is two taps: your start date, then your end date, and the page reloads itself. The panel tells you where you are while you do it (Tap a start date, then an end date), and future days are greyed out because there is nothing to report on a day that has not happened yet.
A small thing worth knowing: while the new dates load, the previous numbers stay on screen with a little spinner next to the picker. The page shifts once instead of flashing empty at you.
Step 2: Read the cards at the top
Six cards, one line each: the label, the figure for your dates, and how that figure compares with the window immediately before it.
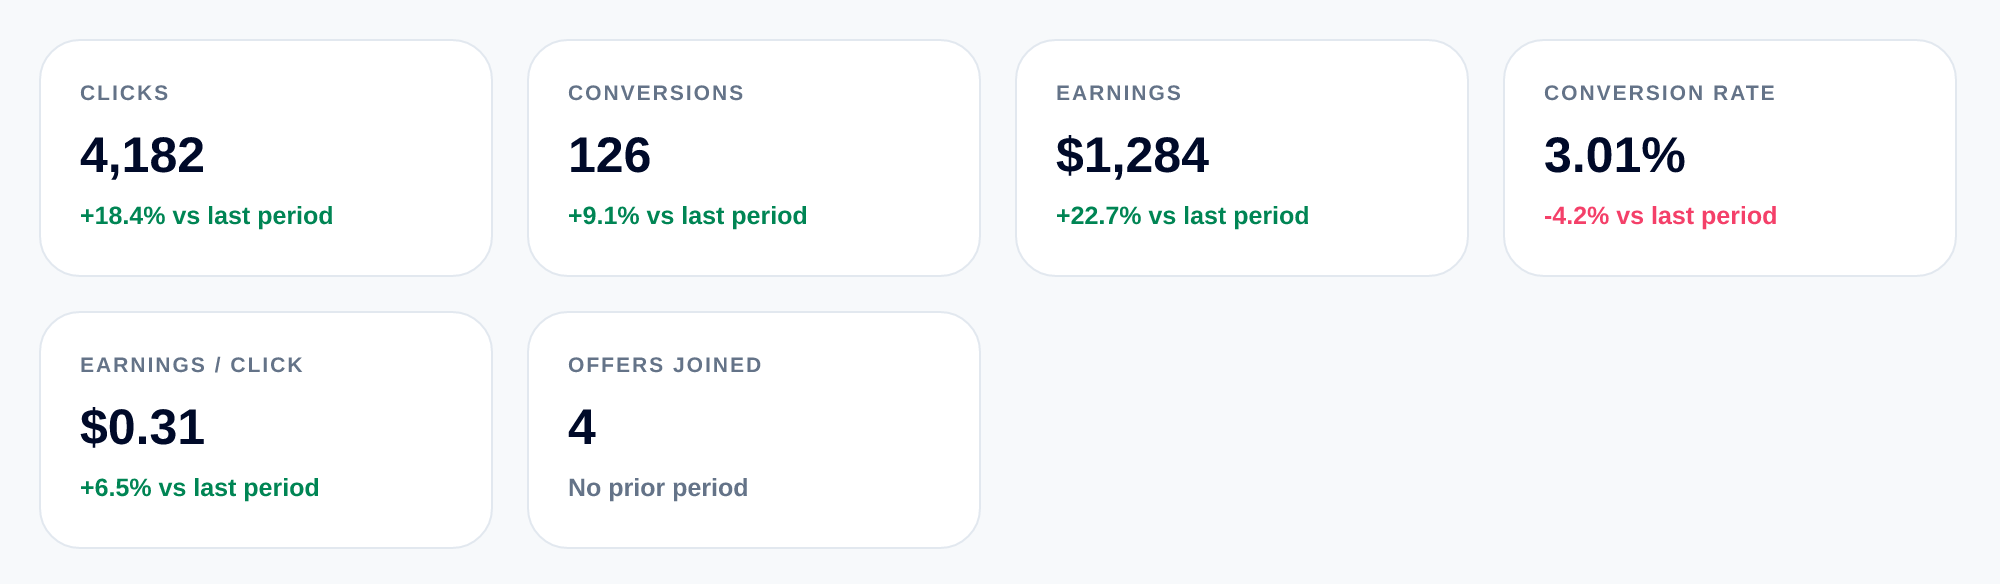
- Clicks; the traffic your links sent in these dates.
- Conversions; how many of those turned into a tracked result.
- Earnings; what those results are worth to you.
- Conversion Rate; conversions as a share of clicks.
- Earnings / Click; what one click is worth to you on average.
- Offers Joined; how many campaigns you joined inside these dates.
The bold little line under each figure is the comparison, and it is the most useful part of the card. It measures your dates against the equally long window right before them, so on a 30-day range you are being compared with the 30 days before that, not with a month on a calendar. Green means up, red means down.
Sometimes it reads No prior period instead. That is not an error: there was simply nothing in the window before to compare with, which is normal when you are new or when you have just widened the dates as far as they go.
One example of reading them together, using the cards above. Clicks up 18%, Earnings up 22%, and Conversion Rate down 4%, more people clicked, more money came in, and a slightly smaller share of them converted. Growth, in other words, not a problem. The cards are meant to be read as a set like this; any single one on its own can tell you a slightly misleading story.
Step 3: The Daily trend
The cards give you one number for the whole window. This panel breaks that window into days, so you can see whether it arrived steadily or all in one weekend.
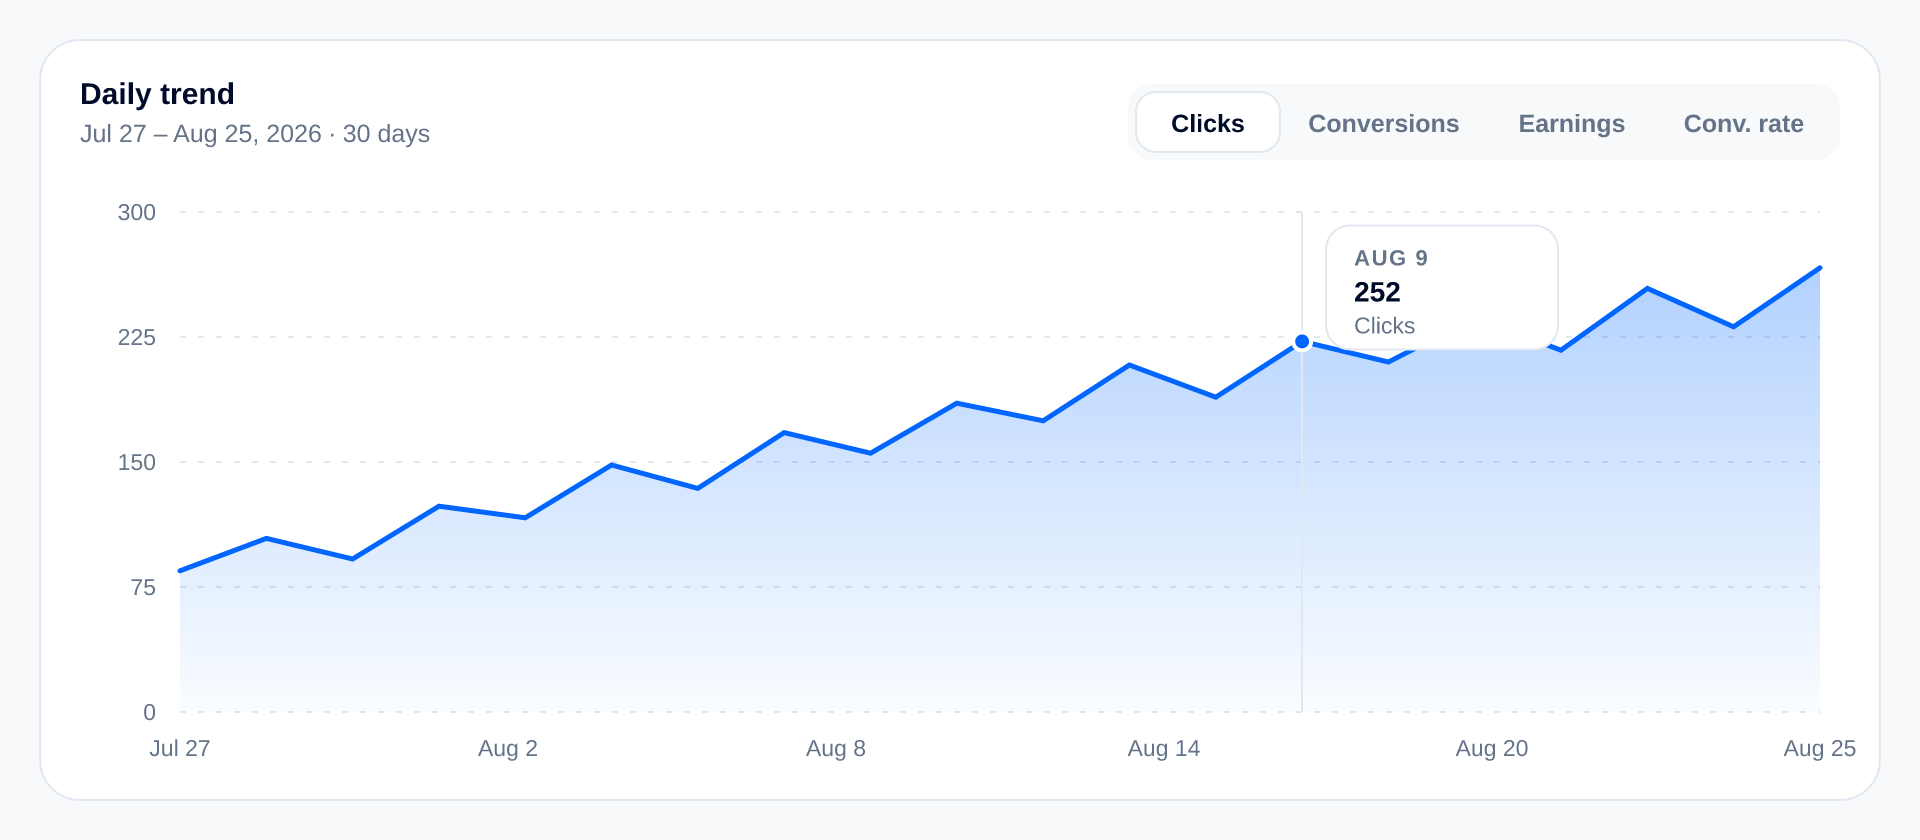
The subtitle repeats the dates and how many days they cover, so you always know what you are looking at. The four buttons in the corner switch which line is drawn; Clicks, Conversions, Earnings, Conv. rate, and only one is shown at a time, on purpose: one line is readable, four on top of each other are not.
Hover or tap any point and you get that single day on its own: the date, the value and which metric it belongs to. The axis follows the metric you picked, so Earnings reads in money and Conv. rate reads as a percentage.
Two details that save confusion. A day where nothing was clicked sits at zero on the Conv. rate line rather than breaking the chart. And if you pick a single day, there is nothing to draw a line between, so that day shows up as one dot instead of an empty chart.
What to look for here is shape, not exact numbers: a steady climb, a flat stretch, or one tall spike that turns out to be a single post doing all the work.
Step 4: Your best
A podium of your three best-earning campaigns in these dates, first, second and third.
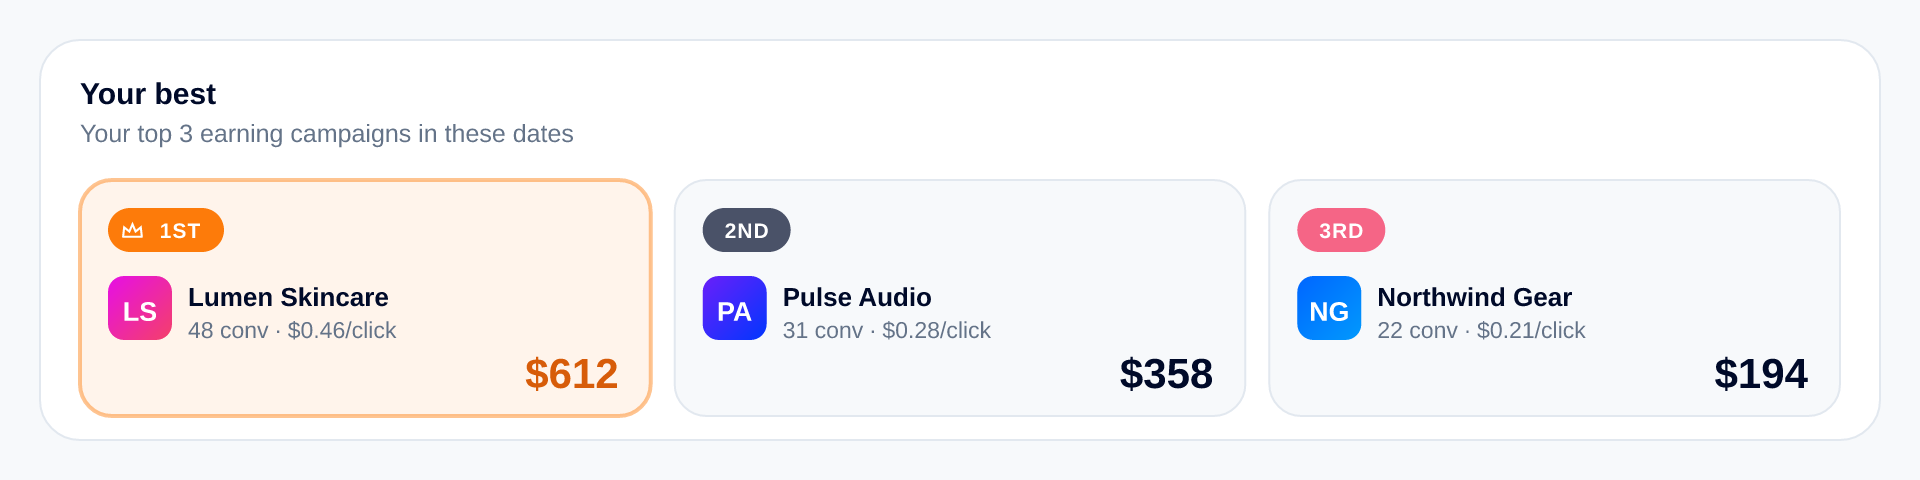
Only campaigns that actually paid you can take a place, and the order re-shuffles on its own the moment one campaign out-earns the one above it. Under each brand you get its conversions and what one click was worth on it, which is what makes second place interesting: a smaller campaign that pays more per click is often the one worth more of your time.
If nothing has paid yet in your dates, the panel says No winners yet and explains that the three places fill up as soon as your campaigns start paying. Nothing is broken; there is just no podium to show.
Step 5: By offer
This is the table version of the whole tab, and the panel you will spend the most time in. It shows your ten best performing campaigns, highest earning first.
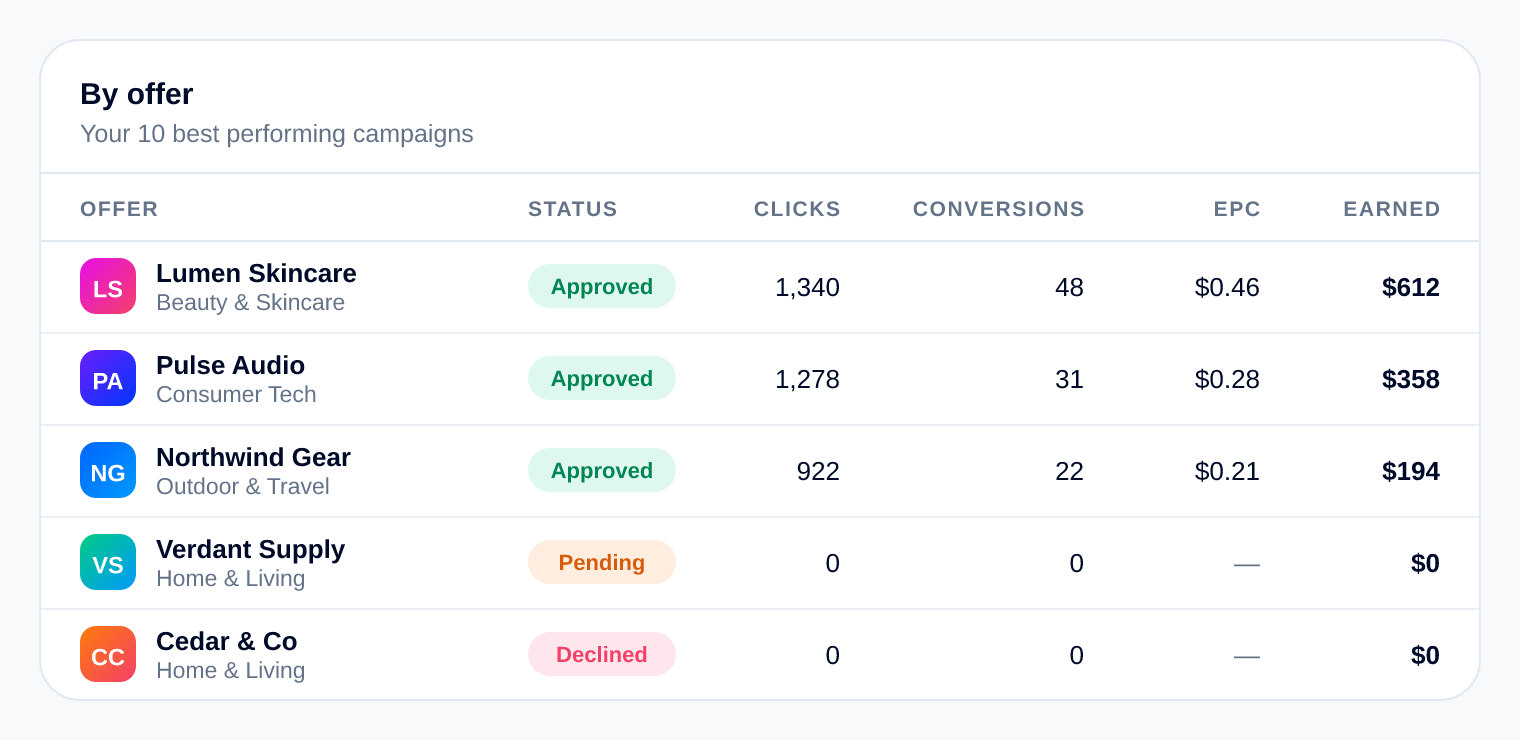
Column by column:
- Offer; the brand, with its category underneath it.
- Status; where your application to that campaign stands, exactly as it appears in My Campaigns.
- Clicks and Conversions; that campaign's share of your dates.
- EPC; earnings per click on that campaign. A campaign with no clicks in these dates shows a dash instead of a zero, because there is nothing to work it out from.
- Earned; what the campaign paid you in these dates.
The Status column is the reason this table beats the podium for everyday use: a row can be sitting at zero simply because you are still Pending on it, which is a completely different thing from a campaign that is live and quietly earning nothing. Read the status before you judge the numbers.
What the money did after it was earned is a separate story, and it lives on its own tab, the guide to the Earnings & Payouts tab picks it up from here if you want the whole path.
Step 6: By category
The ring answers a question the table cannot: what kind of brands do you actually work with?
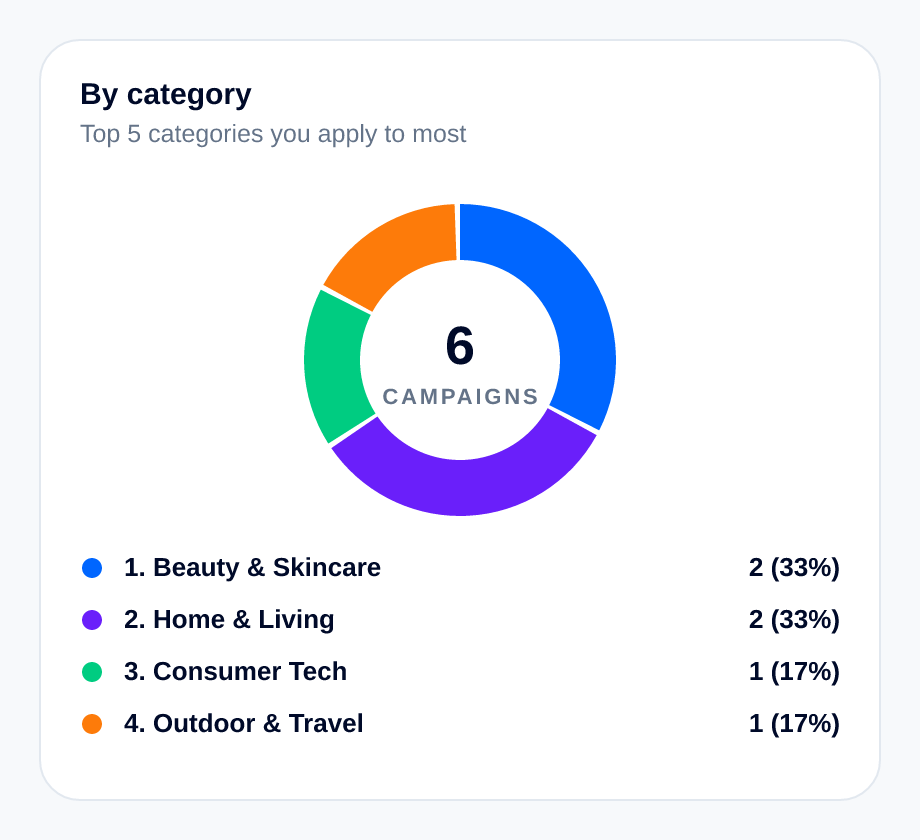
It is your top five categories counted by how many campaigns sit in each; one campaign, one count, no matter what it paid. The middle of the ring shows the total number of campaigns in your dates, the legend doubles as the ranking, and anything outside the top five is rolled into one quiet slice called Other categories so the ring always adds up to everything you have. Tap a slice and you get its name, its count and its share.
Step 7: Earnings by category
The same categories, counted by money instead of by campaign. Each category keeps the colour it had in the ring above, so you can read the two panels against each other.
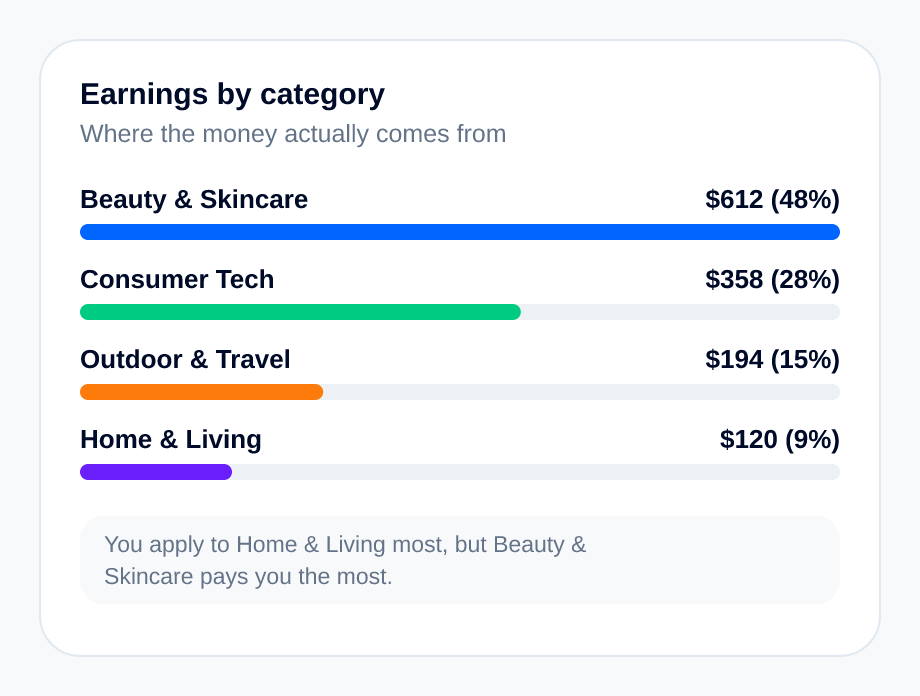
Each bar is drawn against your best-paying category rather than against the total, which keeps the smaller ones visible instead of squashing them to nothing. Alongside each one you get the amount and its share of your earnings.
And if the category you apply to most is not the category that pays you most, the panel says so in a line at the bottom; you apply to X most, but Y pays you the most. That gap is usually the single most useful sentence on this page, because it is the one that changes what you apply to next.
When a panel has nothing to show
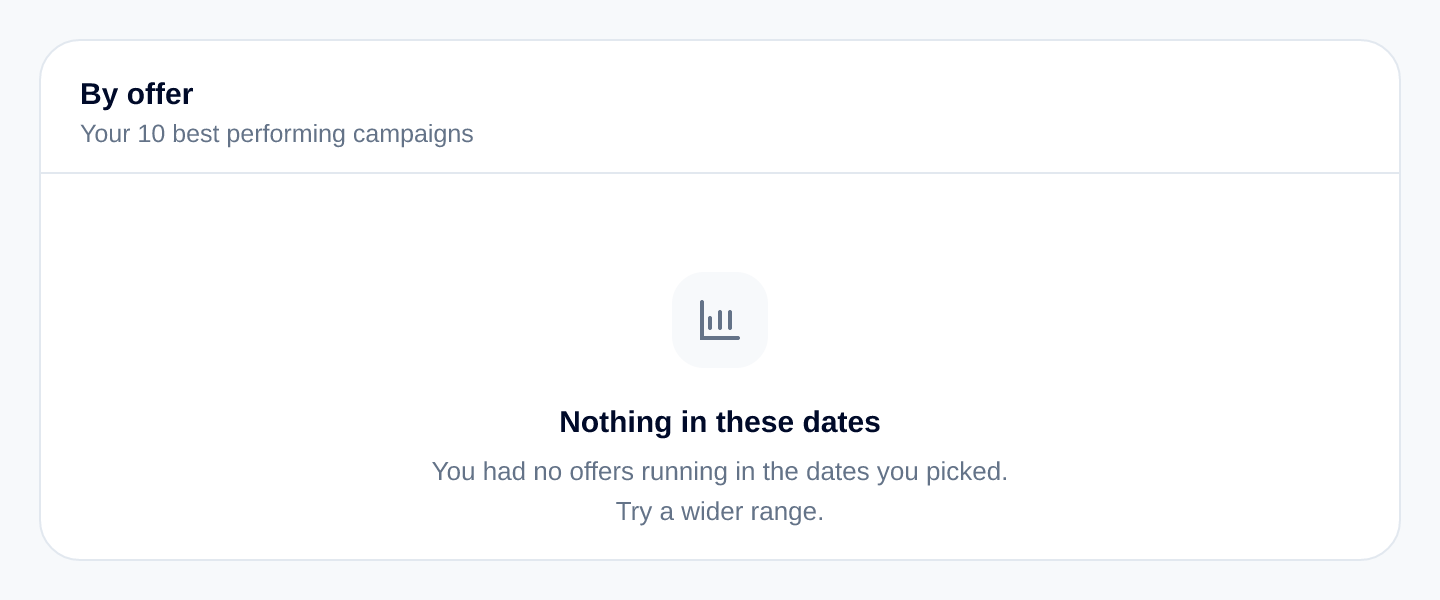
Pick a window where you had no campaigns running and the table says Nothing in these dates, and suggests trying a wider range. It is a date problem, not a tracking problem; widen the range and your numbers come back. The category panels do the same thing in their own words when there is nothing in the window.
How to read the whole tab in a minute
- Set the dates first; nothing on the page means anything until you have.
- Read the six cards as a set, and pay attention to the comparison line under each one.
- Use Daily trend for shape: steady, flat, or one spike.
- Use By offer for decisions, and read the Status column before you judge a row.
- Compare the ring with the bars: what you apply to, against what pays you.
- Then compare two windows: this month against last month is the honest test of whether something you changed worked.
If a campaign here is doing less than you expected, the fix is usually further upstream than the numbers: how the offer was set up in the first place, which is covered in reading an offer properly, and what you put in front of your audience, which is covered in creating high-converting content. This tab tells you where to look; those two tell you what to change.
Give your reports something to measure
Fill that bar with offers that fit you
Every line on this tab started as one offer you said yes to. Browse the live campaigns, apply free, and watch the numbers do the rest.
Browse the marketplace →Related reading
- Spark Ads and Partnership Ads: How Creator Whitelisting Works — Whitelisting lets a brand run ads through a creator's own account. Here is how Spark Ads codes and Meta Partnership Ads permissions actually work.
- Affiliate Marketing for Brands: A Complete Guide — What the channel is actually good at, what it is bad at, how to budget for it honestly, and the operating rhythm that separates a programme that compounds from one that flatlines.
- Affiliate Marketing vs Influencer Marketing: What's the Difference? — One pays for a result, the other pays for a slot. A breakdown of who carries the risk, what each one costs, how to measure them honestly, and why most brands end up running both.
More from the Wooly Network Knowledge Library